
<p><a href="https://aws.amazon.com/elasticache/">Amazon ElastiCache</a> for Valkey now features ElastiCache Insights, a pre-built dashboard in Amazon CloudWatch for your node-based clusters. ElastiCache Insights brings cluster health, memory, compute, network, command throughput, latency, keyspace, and errors into a single view sourced from a set of OpenTelemetry metrics that ElastiCache publishes automatically.</p>
<p>You can use ElastiCache Insights to check the health of your cache workloads across a Region at a glance, detect when a node nears its memory, network, or connection limits, and filter your view to a cluster, shard, node, or Availability Zone. You can also save a copy as the starting point for a custom dashboard tailored to your workload.</p>
<p>With detailed monitoring, you can choose metrics to publish every 15 seconds and view them on the Metrics tab or in your custom dashboard. <a href="https://aws.amazon.com/cloudwatch/pricing/">CloudWatch pricing for OpenTelemetry metrics</a> applies to ElastiCache detailed monitoring.</p>
<p>To get started, open the Metrics tab for a cluster in the <a href="https://console.aws.amazon.com/elasticache/">Amazon ElastiCache console</a> and choose View in ElastiCache Insights. You can also choose ElastiCache Insights under Infrastructure Monitoring in the Amazon CloudWatch console.</p>
<p>ElastiCache Insights is available for node-based Valkey clusters in all AWS Regions where Amazon CloudWatch supports OpenTelemetry metrics. To learn more about ElastiCache Insights, see <a href="https://docs.aws.amazon.com/AmazonElastiCache/latest/dg/otel-metrics.html#otel-metrics.insights-dashboard">Monitoring ElastiCache with OpenTelemetry metrics</a> in the Amazon ElastiCache User Guide.</p>
Amazon ElastiCache for Valkey introduces ElastiCache Insights

From the official release
This is a short excerpt. Read the full announcement on the official source.
Continue on aws.amazon.com → (opens in a new window)Related stories
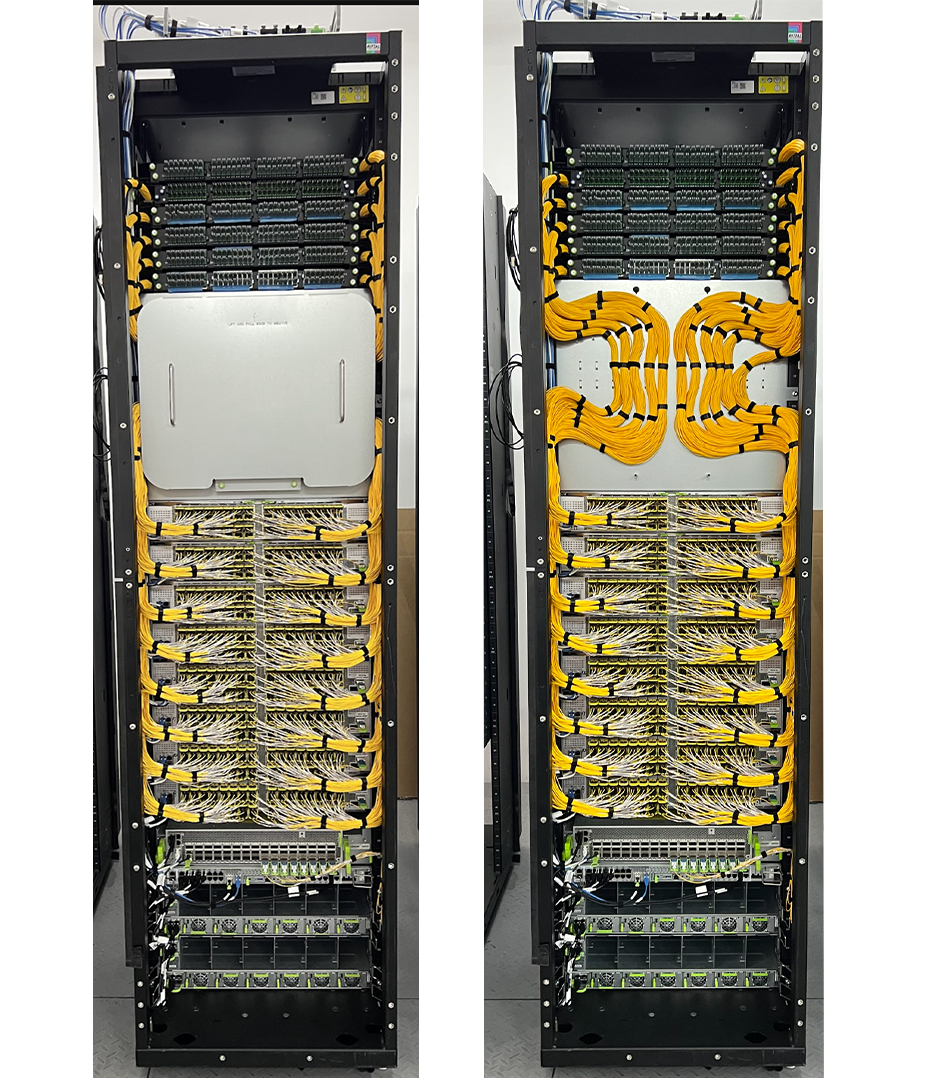
OCP Summit 2026: Powering AI with Open Innovations in Scale-Up, Scale-Out, and Scale-Across Networks
Meta Engineering
At the 2026 Open Compute Project Global Summit, Meta is sharing the next generation of open networking infrastructure, including: Our first liquid-cooled network rack (IcePack), and 102.4T switch platform (IceCube). Flattened Planar Fabric (FPF), a multiplane backend scale-out fa

Agentic AI in Manufacturing: Scale From Pilot to Production
Snowflake Blog
See how manufacturers scale agentic AI from pilot to production with a four-stage roadmap for governed data, autonomous operations and C-suite approval.
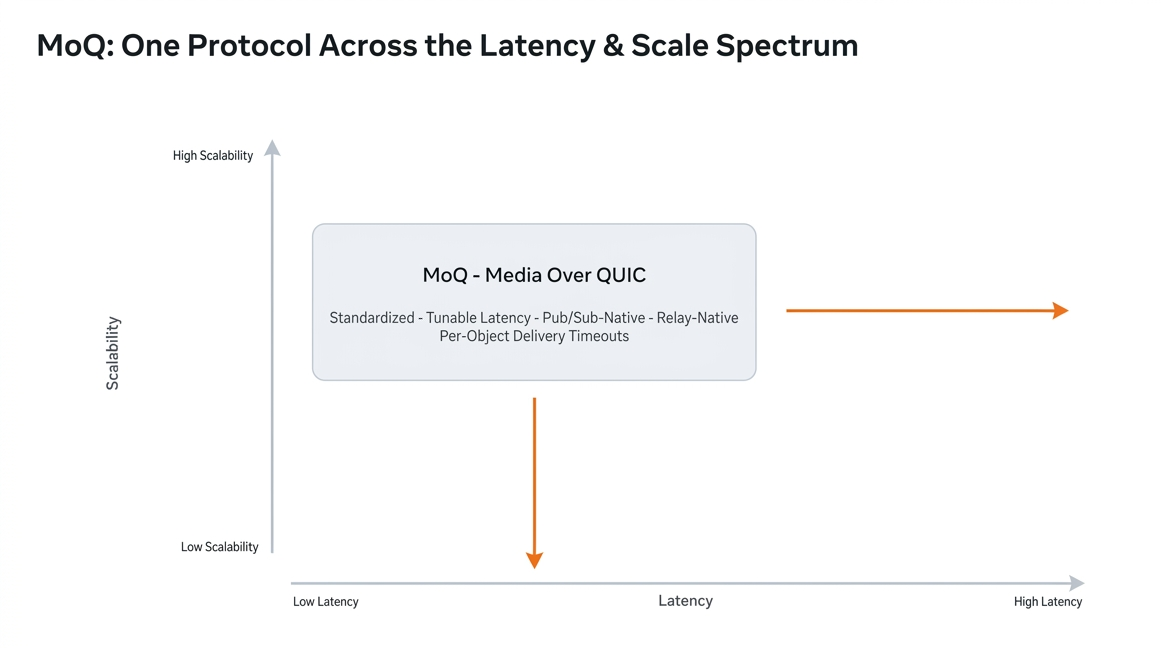
Shipping Media Over QUIC at Meta Scale for Instagram Live Ingest
Meta Engineering
Meta has begun deploying Media over QUIC (MoQ), an emerging open protocol for real-time video streaming at scale. MoQ will help simplify our protocol stack for live streaming video and enhance overall user experience for live video. We’re sharing how we shipped MoQ on Instagram L
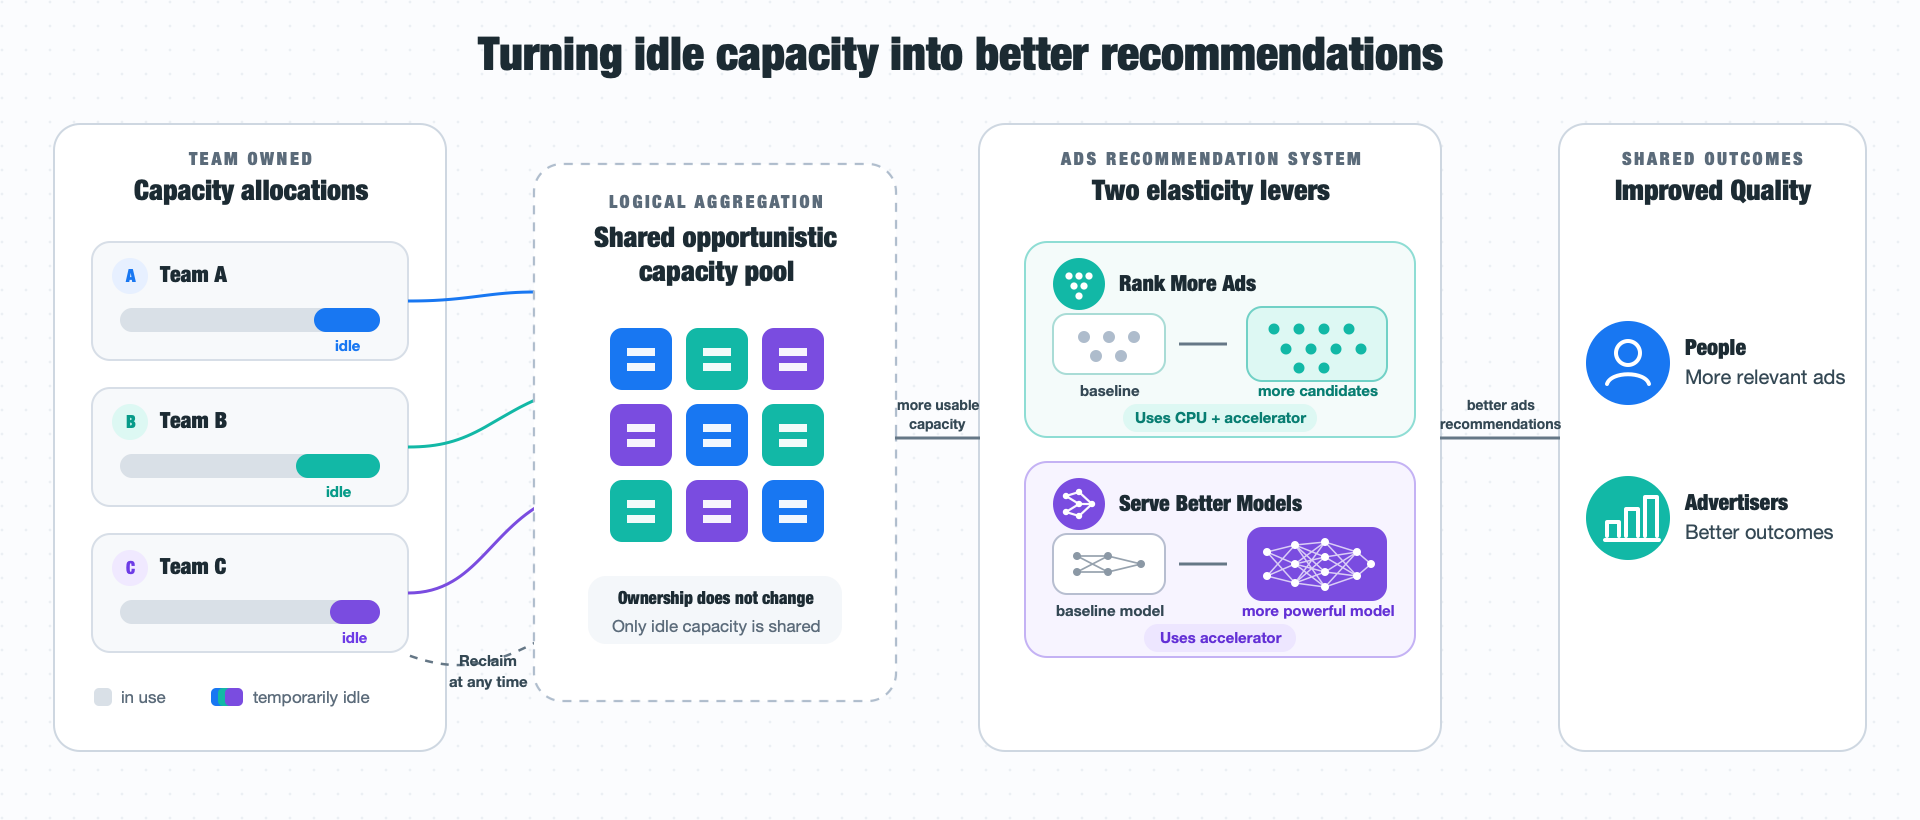
Turning Opportunistic AI Inference Capacity Into Better Ads Recommendations
Meta Engineering
At Meta, we’ve built a system that enhances ads recommendations by leveraging idle inference capacity in our fleet. Two elasticity levers in the system allow ads recommendation work to expand across opportunistic capacity, without compromising baseline performance. This post desc

Introducing Semantic Studio: The Semantic View IDE
Snowflake Blog
Semantic Studio is now GA. Author, debug, and deploy semantic views in Snowflake Workspaces — with Snowflake CoCo, git versioning and CI/CD in one place.
AWS Transfer Family supports custom ports for public SFTP servers
AWS What’s New
AWS Transfer Family now lets you configure custom ports on public SFTP servers and choose a communication mode for each port. You can support clients that require different ports or start SFTP connections differently on a single server. Previously, public SFTP servers accepted co